SPC24
Live-cell imaging of Indian muntjac fibroblasts stably expressing H2B-GFP to visualize the chromosomes (green) and treated with 50 nM SiR-Tubulin to label spindle microtubules (magenta). Scale bar, 5 μm. Time, hr:min.
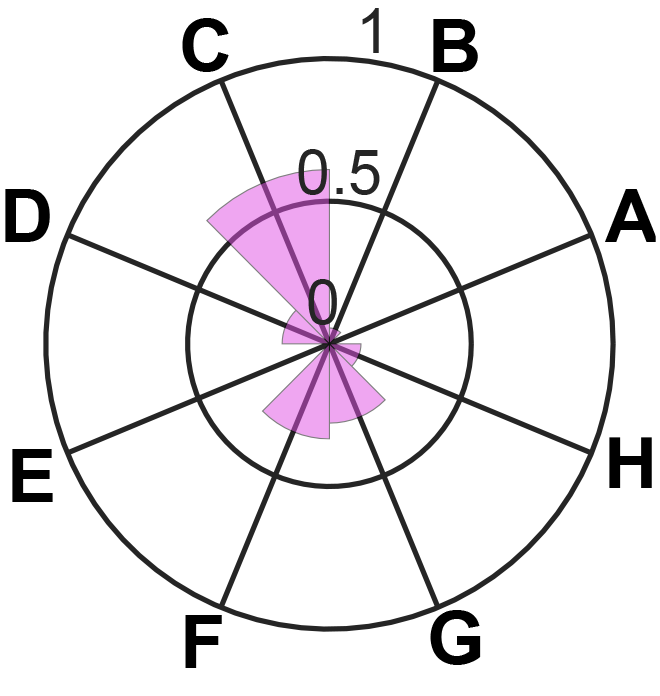
Radar plot displaying the phenotypical fingerprint after RNAi depletion based on the frequency of eight mitotic features: A) incomplete congression and faster mitosis; B) incomplete congression and normal mitotic duration; C) incomplete congression and prolonged mitosis; D) congression delay; E) metaphase delay; F) anaphase lagging chromosomes; G) mitotic death and H) cytokinesis failure. 0= null-event, 1=event that occurred in all analyzed cells.
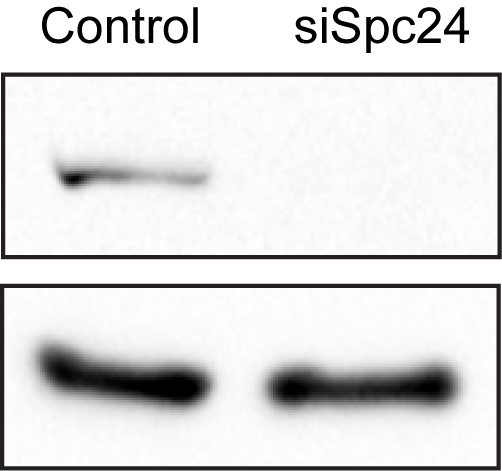
Protein lysates obtained after siRNA were immunoblotted with an antibody specific to each protein of interest. GAPDH was used as loading control.
Full WB here
Full WB here
Note 1: The cells were transfected with 50 nM of the target siRNA, 48h prior to live cell imaging/imunoblotting.
Note 2: ~17% of the cells exited mitosis with massive chromosome missegration (multiple laggings and DNA bridges).
Note 2: ~17% of the cells exited mitosis with massive chromosome missegration (multiple laggings and DNA bridges).