NUF2
Live-cell imaging of Indian muntjac fibroblasts stably expressing H2B-GFP to visualize the chromosomes (green) and treated with 50 nM SiR-Tubulin to label spindle microtubules (magenta). Scale bar, 5 μm. Time, hr:min.
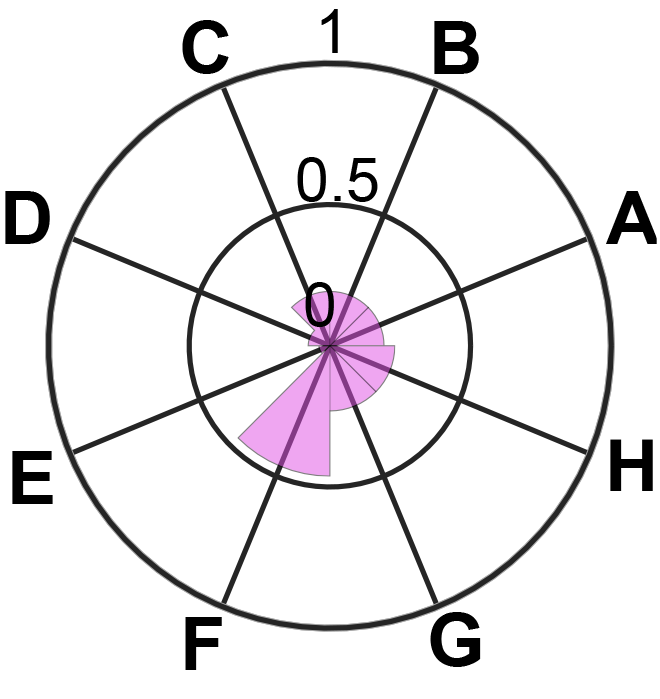
Radar plot displaying the phenotypical fingerprint after RNAi depletion based on the frequency of eight mitotic features: A) incomplete congression and faster mitosis; B) incomplete congression and normal mitotic duration; C) incomplete congression and prolonged mitosis; D) congression delay; E) metaphase delay; F) anaphase lagging chromosomes; G) mitotic death and H) cytokinesis failure. 0= null-event, 1=event that occurred in all analyzed cells.
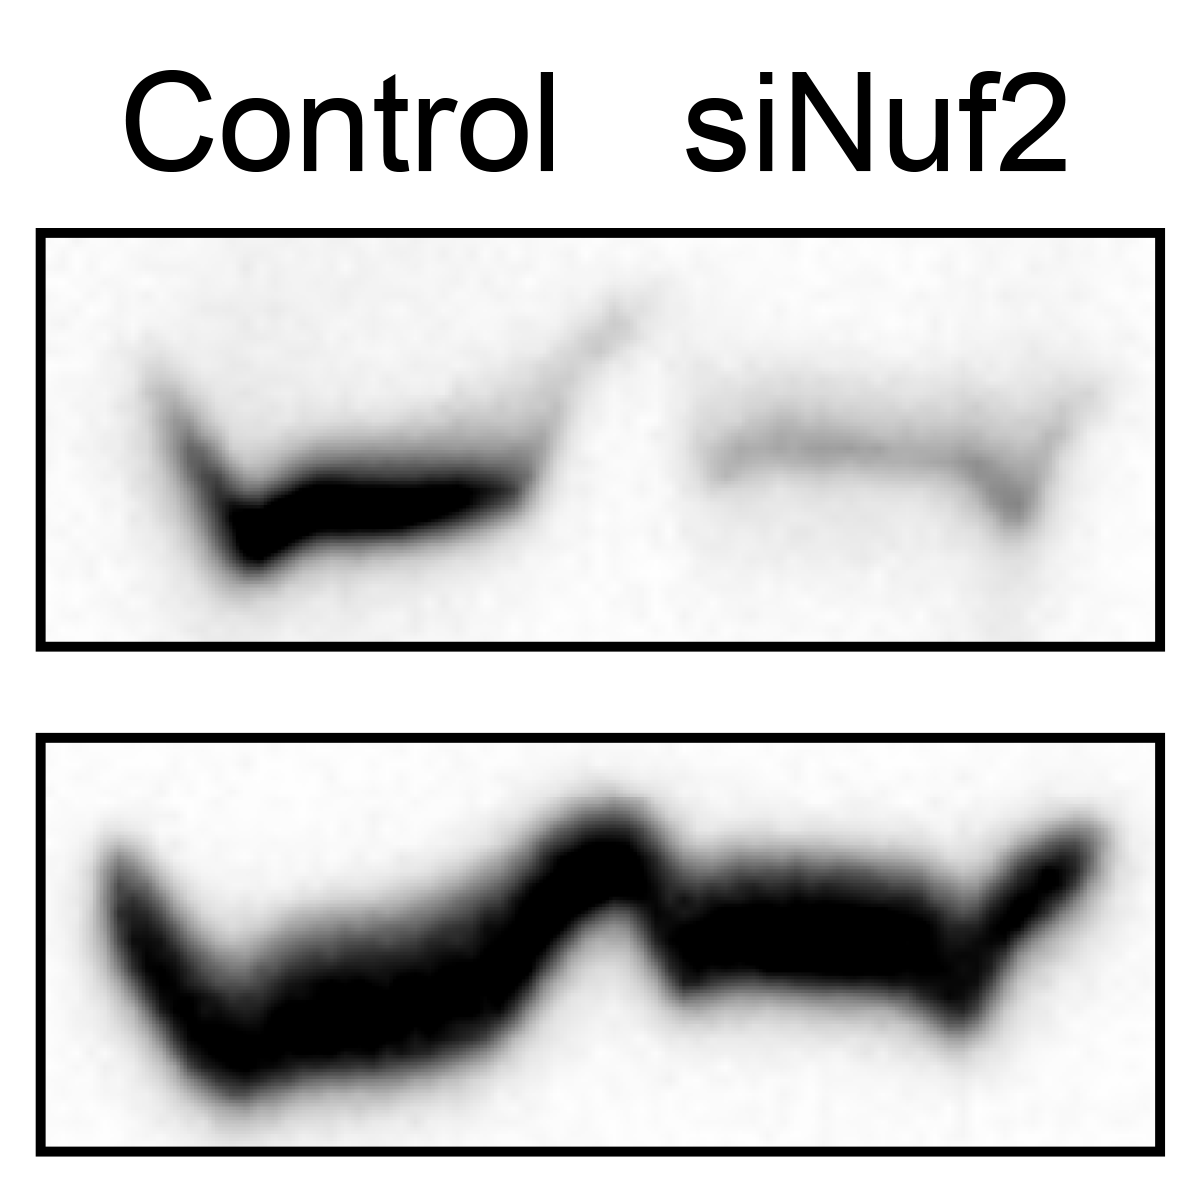
Protein lysates obtained after siRNA were immunoblotted with an antibody specific to each protein of interest. Alfa-tubulin and GAPDH were used as loading controls, respectively.
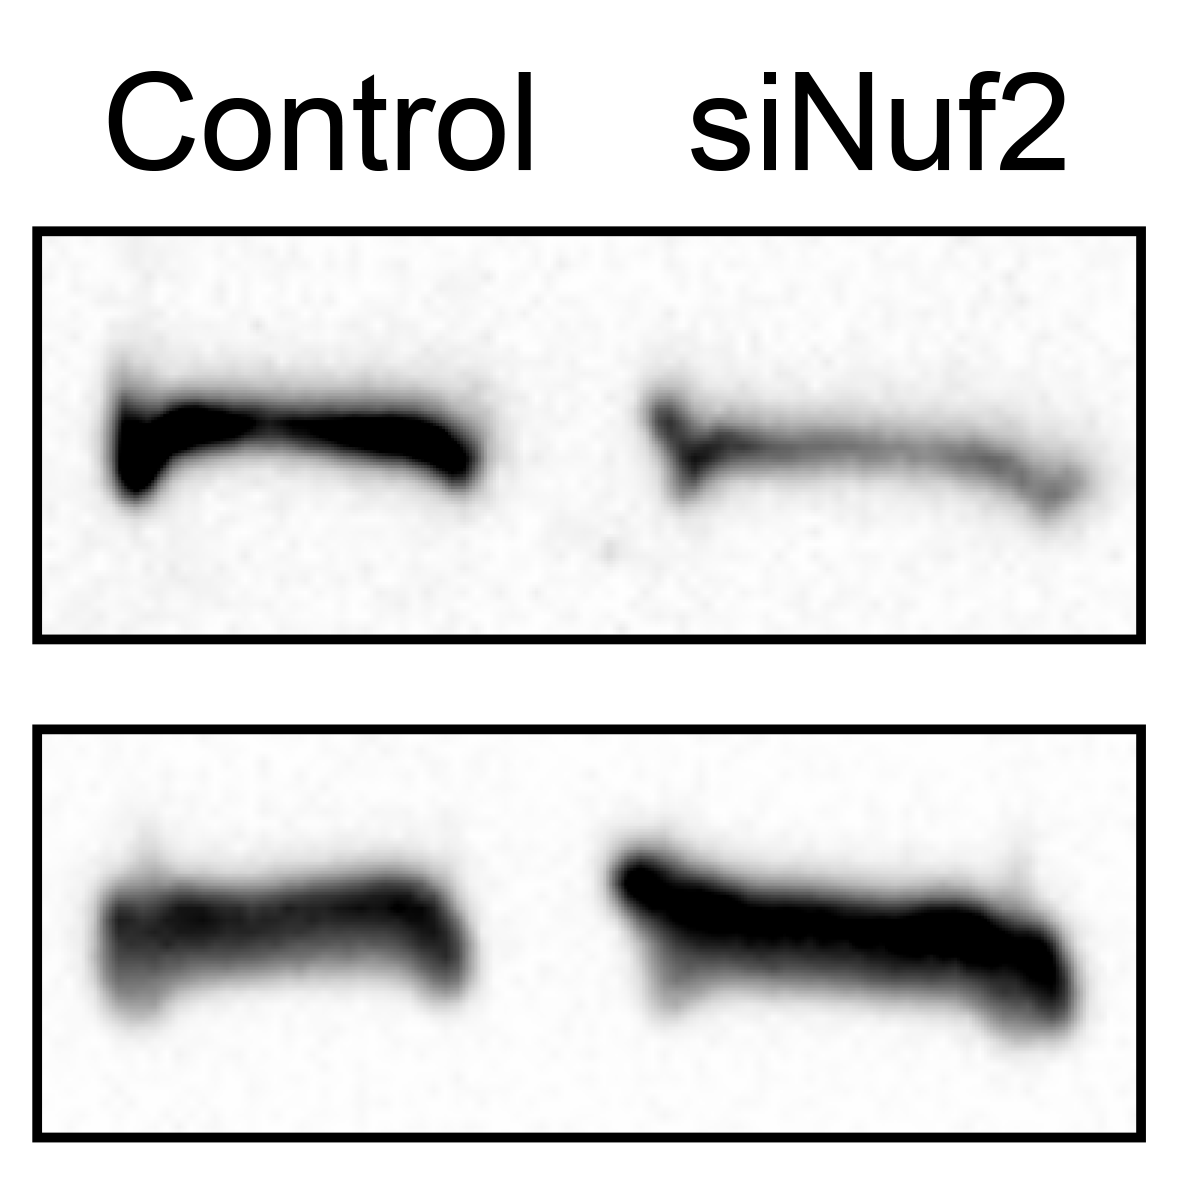
Note 1: The cells were transfected with 50 nM of the target siRNA, 24h prior to live cell imaging/imunoblotting.
Note 2: ~23% of the cells exited mitosis with massive chromosome missegration (multiple laggings and DNA bridges).
Note 2: ~23% of the cells exited mitosis with massive chromosome missegration (multiple laggings and DNA bridges).